
The shifts in investor sentiment have been a whipsaw. Maybe this is the start of a generational opportunity to “buy the bottom” in long-term bonds. Or, maybe it is just Lucy pulling the football away from Charlie Brown again as he’s about to kick it. Let’s see what a quick set of charts does to help us understand the story the market is trying to tell us.
First, here is the chart of what’s driving a lot of the sudden sense of urgency for some investors. The iShares 20+ Year Treasury Bond (NASDAQ:TLT) ETF (TLT) is an ETF that tracks 20-to-30-year US Treasuries, which tend to be more volatile than shorter-term bonds. And is that ever an understatement lately!
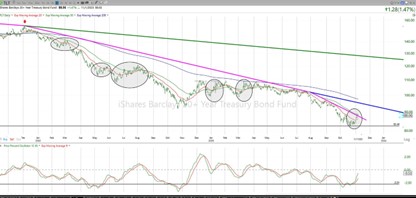
The pink line shows the downtrend in place since late 2021. You can see how in August of this year, its rate of decline increased. That dropped the price of TLT by more than 15% in just three months.
The near-term market reaction has been “buy the bottom in long-term bonds.” But while TLT quickly jumping through the pink downtrend line is encouraging, it’s not “game over” for bond bears. The blue line is a more important target, since anything short of that is a “bear market bounce.”
Conclusion: The recent rally in TLT and its peers is a good start. But I still see it as a high-reward/high-risk situation.
Second, for much of this year, the Invesco QQQ Trust was the only thing in the global stock market showing up. The returns of the top seven or eight stocks were so big, it masked the very low positive or negative returns of most of the market during 2023. QQQ dipped by about 11% from July until last week, when it burst out of the gate like a thoroughbred.
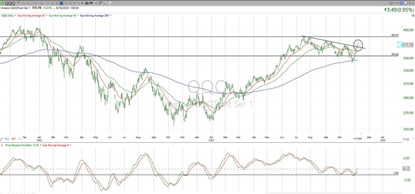
And while the S&P 500 looks like it is having a tepid, tenuous bear market rally, still within its trading range, QQQ just peaked its head above its recent downtrend line. So, perhaps there’s another 4% rally in store until it regains the full amount of that recent drop.
Even if that happens, my question is, then what? With so many laggard effects on the economy from the Fed’s 11 rate hikes just starting to hit the economy and employment levels, can the stock market just keep blowing it off? No crystal balls here, but the stronger the “Naz” and its small number of giant stocks carries the load, the more it starts to look like the “safe haven” asset, the only place where stock returns can be had.
I’m not on board with that yet, but I do know that this is the time of year where professional money managers may feel pressure to play catch up. Or “chase” the part of the market they didn’t own when the QQQ was soaring earlier this year.